Graphs and Data that Show Global Warming Effects Today and in the Future
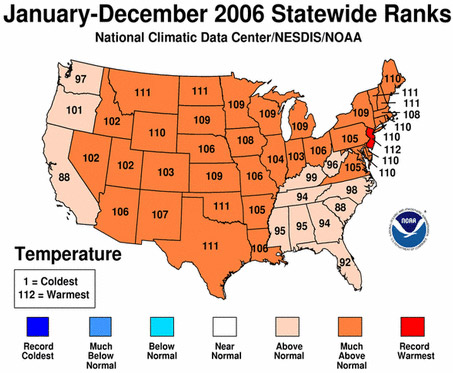
Here is a graph showing the data on Temperature in the United States for 2006, notice that in most states the temperatures were "much above normal".
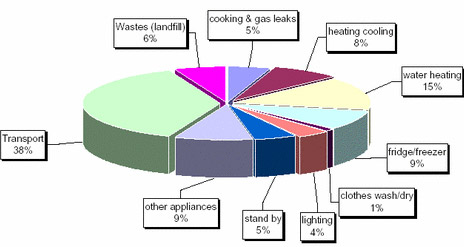
Graph of the Sources of Greenhouse Gases
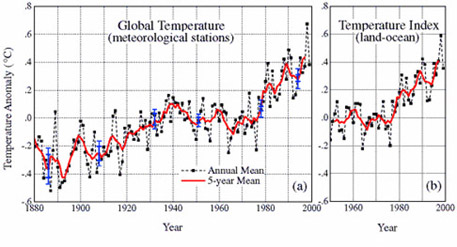
Global Temperatures Are Indeed Rising